M-values are a way scientists draw a solid line in a blurry domain. They help us quantify safe limits in diving and make it a safer sport. The M in M-values stands for "Maximum", but what exactly are they the maximum of?
Of course, a short answer isn't enough to cover everything M-values represent, and therefore, we'll have a look at concepts such as partial pressures and compartments to be able to explain what M-values are and how they work fully.
Partial pressures
Before explaining more complex concepts, let's recap an important topic that is central to M-values: partial pressures.
To give a definition, the partial pressure of a specific gas in a gas mixture is the pressure that the gas would create if it occupied the same volume alone. In other words, it is the pressure induced by this specific gas. To calculate the partial pressure of a gas, we simply need to multiply the total pressure by the fraction of the gas in the gas mix.
\( P_{gas} = P_{tot} \cdot F_{gas} \)Let's give a concrete example, if we want to find the partial pressure of oxygen (ppO2) at sea-level: The air we breathe at atmospheric pressure (sea-level) is made up of 20.9% Oxygen, 78.1% Nitrogen, 0.9% Argon, and <0.1% other substances; the atmospheric pressure is 1 atm. This means that the total pressure we are subjected to at sea level is 1 atm, and the partial pressure of oxygen is the part of that pressure that is induced by oxygen alone, or 20.9% of 1 atm, which is ppO2 = 0.209 atm.
If we wanted to find the partial pressure of Nitrogen at sea level (which is more relevant when talking about M-values), we would simply have to calculate:
ppN2 = Ptot x FN2 = 1 atm x 0.781 = 0.781 atm
In the context of air, we could write:
\( P_{air} = P_{O^2} + P_{N^2} + P_{Ar} + P_{other}\)When we are diving, the partial pressure of the gases we breathe doesn't stay constant. This is because the deeper we go, and the more the total pressure increases, the more the partial pressure of each gas we breathe increases proportionally. We previously saw that at the surface, the ppN2 is about 0.78 atm. If we go to a depth of 10 meters, we are increasing our total pressure to 2 atm (we are doubling it from the surface), and we can calculate the ppN2 = 2atm x 0.78 = 1.56 atm. Essentially, by doubling our total pressure, we also doubled the amount of nitrogen we expose ourselves to.
Henry's law states that the amount of gas that can be dissolved in a solution (here, you have to imagine our body as the "solution") is proportional to its partial pressure. This means that all the extra nitrogen we expose ourselves to at depth dissolves without issues in our body, but upon surfacing, the amount of Nitrogen that can be dissolved is reduced; if there is too much nitrogen dissolved when reducing the pressure, the nitrogen may come out of solution as bubbles, which can cause decompression sickness. When doing decompression dives, the whole idea is finding the line between shallowing up enough to off-gas the excess nitrogen in our tissues and not shallowing up too much, as to keep the ambient pressure high enough to keep that nitrogen dissolved in our body, thereby avoiding the formation of bubbles.
To read more about partial pressures, you can read this article.
Compartments
Haldanian and neo-Haldanian models (read more about those here) consider that the body is made up of "compartments". This means that the nitrogen, instead of diffusing in and out of our body into one "block", goes into different parts of our body (compartments) at various speeds. You can imagine those compartments as being different areas in your body that are more or less perfused. For instance, "fast tissues" (or tissues that saturate and desaturate fast) are modeled by compartments with a low half-time, and include tissues such as the skin or the lungs. "Slow tissues", which are represented by compartments with high half-times (meaning that they saturate and desaturate more slowly), include cartilage, bones, articulations, etc...
Different models have different numbers of compartments: 16 compartments is the standard number, although it isn't uncommon to find variations only using 12 or 8 compartments.
The lower-numbered compartments (1, 2, 3, 4, etc...) are usually the "fast" ones, while the higher-numbered ones (16, 15, 14, 13, etc...) are the slower compartments. You can observe in the graph below how fast different compartments saturate.
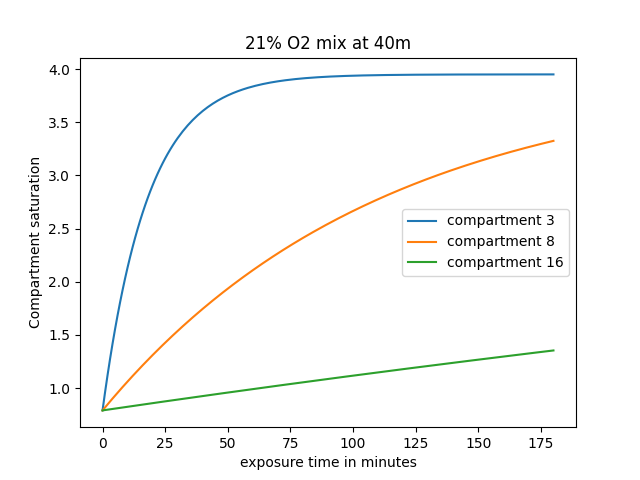
In this scenario, we are monitoring a fast compartment (number 3), a mid-compartment (number 8), and a slow one (number 16) being saturated with a nitrogen partial pressure of 3.95 atmospheres (equivalent of breathing air at a depth of 40 meters). At the start, they are all at surface atmospheric pressure (0.79 atmospheres of Nitrogen). As time advances, they slowly saturate, and while compartment 3 saturates after about 50 minutes, compartments 8 and 16 are still well on-gassing.
The key point about compartments is that each compartment saturates and desaturates independently and can hold a certain partial pressure of dissolved nitrogen; this will be important when talking about M-values, as M-values describe the maximum amount of Nitrogen each compartment can have at each depth.
What are M-values?
Now that we understand partial pressures and compartments, we can have an in-depth explanation of what exactly M-values are:
M-values are the maximum allowed amount of dissolved inert gas (each different inert, such as nitrogen or helium, has a different M-value) in each compartment: having a dissolved inert gas partial pressure greater than the M-value in a certain compartment significantly increases the risk of bubbles forming. An important concept to keep in mind is that M-values are an attempt at creating a solid line in a fuzzy domain: this means that a lot of variables come into play, just because you exceed the M-value slightly doesn't necessarily mean you are guaranteed to get DCS, in the same way as staying under the M-value doesn't necessarily mean you will avoid getting DCS. Instead, you have to think of it as a game of probabilities; the further away you stay below the M-value, the better your chances are at avoiding DCS (and this is where gradient factors come into play, which we will talk about later); and conversely, the more you exceed the M-value, the higher your risks and the more severe your DCS might be.
For every compartment, M-Values vary as a function of the depth the diver is at (it actually varies with pressure, but as pressure is proportional to depth, it is easier to imagine the M-values to vary with the depth). Intuitively, you can imagine that the deeper you go, the more nitrogen will be able to be dissolved in your tissues, and the shallower you go the less Nitrogen will be allowed to be dissolved in your tissues (and if you shallow up while your tissues are supersaturated in nitrogen, the nitrogen will force itself out of solution, forming bubbles in your blood and tissues).
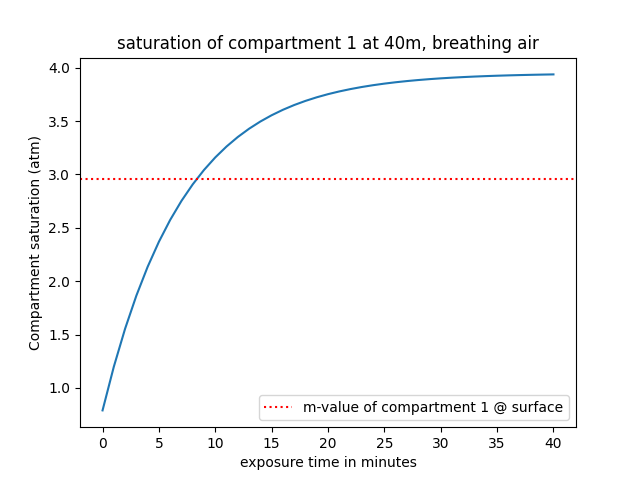
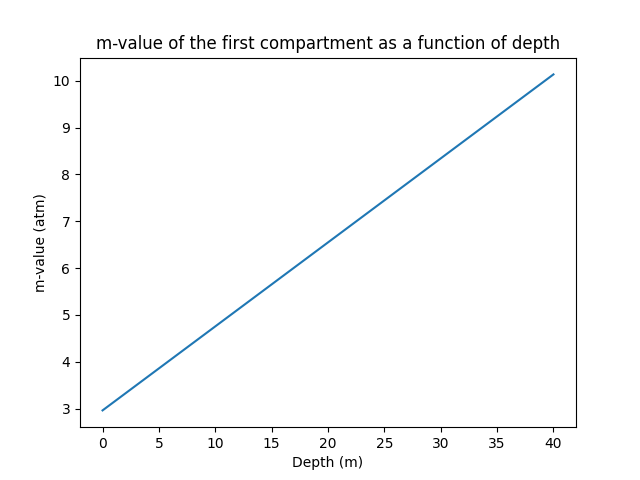
If we simplify it, we can first focus on the M-value at the surface. This value represents how much nitrogen your compartments can tolerate at an ambient pressure of 1 atmosphere before incurring serious risks of DCS. To give a numerical value, the Nitrogen M-value at the surface of compartment 1 is approximately 2.96 atm. This means that once the compartment reaches a dissolved nitrogen partial pressure of 2.96 atmospheres, the m-value of this compartment is reached, and the diver wouldn't be able to ascend straight to the surface without performing mandatory decompression stops. To put that into perspective, below is a simulation of the evolution of the nitrogen saturation in compartment 1 at 40m while breathing air.
Using m-values, we can conceptualize a safe limit that shouldn't be exceeded (at least during recreational diving - technical divers exceed this limit all the time, but then require decompression before ascending to the surface). But we mentioned previously that m-values vary as a function of depth, and on the graph above, we only represented the m-value of compartment 1 at the surface, so let's expand a little bit and add the m-value at 5 meters and at 10 meters:
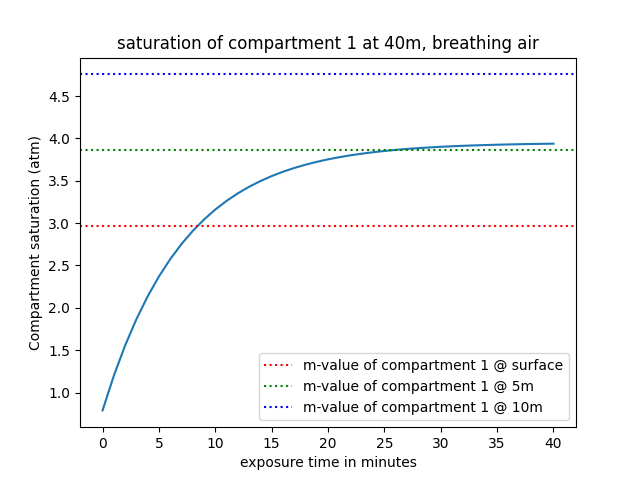
We can actually observe that in this scenario, not only is the m-value at the surface exceeded, but after some time (approximately 25 minutes), the m-value at 5 meters is also exceeded. However, the m-value at 10 meters is never exceeded; this means that after being saturated, the diver can theoretically ascend safely to a depth of 10 meters with minimal DCS risks, but anything shallower than 5 meters (we can also safely say 6 meters is also off-limits by looking at the graph) constitutes a risk.
Before moving on, here are the key points to remember about m-values:
- M-values represent the amount of Nitrogen that can be safely dissolved in a certain compartment at a certain depth before having increased risks of DCS.
- M-values vary with the depth. The deeper you go, the more nitrogen can be dissolved, and the higher the m-value is.
- Each individual compartment's m-value varies differently. Faster tissues can handle a higher tissue tension (meaning more dissolved nitrogen) than slower tissues.
- M-values are not a solid like they make it appear; they are an attempt at creating a solid line in a blurry domain.
How are M-values calculated?
We can identify two main types of m-values, Workman m-values and Bühlmann m-values:
- Workman m-values were developed by Robert Workman in 1965 for the US Navy. The Workman-style m-values enabled divers to calculate the m-value as a function of the depth: it was underrepresented by a straight line, where each compartment had an associated line. Each line would have a different y-intercept and a gradient, respectively representing the M-value at the surface, and the gradient at which the M-value would increase with depth. As Workman m-values are considered outdated compared to the Bühlmann m-values, we won't delve more into them.
- Bühlmann m-values were developed by Albert Alois Bühlmann due to the need to consider the m-values of compartments at ambient pressures under 1 atmosphere and integrate those in a decompression model (Albert Bühlmann was Swiss and dove in high-altitude lakes, where the ambient pressure can drop significantly). The model counts 16 distinct compartments with various and updated tables to calculate the m-values, although the most common ones used to date is the ZH-L16C model (ZH-L standing for Zürich-Linear, 16 for the 16 compartments, and C because the previous iterations of the model were called A and B). To calculate the m-values, the Bühlmann model attributes each compartment with two numbers, a and b. The m-value at a certain depth (called Ptol below) can be calculated as follows:
Here is a table with the a and b values for each compartment (ZHL-16C):
| Compartment | a | b |
|---|---|---|
| 1 | 1.1696 | 0.5578 |
| 2 | 1.0000 | 0.6514 |
| 3 | 0.8616 | 0.7222 |
| 4 | 0.7562 | 0.7825 |
| 5 | 0.6200 | 0.8126 |
| 6 | 0.5043 | 0.8434 |
| 7 | 0.4410 | 0.8693 |
| 8 | 0.4000 | 0.8910 |
| 9 | 0.3750 | 0.9092 |
| 10 | 0.3500 | 0.9222 |
| 11 | 0.3295 | 0.9319 |
| 12 | 0.3065 | 0.9403 |
| 13 | 0.2835 | 0.9477 |
| 14 | 0.2610 | 0.9544 |
| 15 | 0.2480 | 0.9602 |
| 16 | 0.2327 | 0.9653 |
Example: calculating the m-value of the 1st compartment at 6 meters:
Firstly, we have to find the ambient pressure at 6 meters: we can calculate Pamb = (6+10)/10 = 1.6 atm. Then, we can calculate Ptol = a + 1.6/b. For the first compartment, we have a=1.1696 and b=0.5578. We can then calculate Ptol = 1.1696 + 1.6/0.5578 = 4.038 atm.
This means that at a depth of 6 meters, the first compartment can tolerate a nitrogen supersaturation pressure of ~4 atm or under.
The example above shows the m-value of a certain compartment at a certain depth, but as mentioned previously, the m-value increases as the depth increases. To visualise it, we can calculate the m-values for a range of depth, and graph it on a 2-dimensional graph (m-value vs. Depth) and obtain a line, as depicted below:
Depending on the status of the dive, your compartment will be saturated with a certain amount of nitrogen, and you will find yourself at a certain depth, intuitively, you can imagine your compartment being represented by a point on the graph; if the point is above the m-value line, you incur a higher risk of DCS, and therefore, you should aim to keep the point below the line.
If we graph the line for each compartment, using the different a and b values, we would obtain 16 distinct lines (one per compartment) as depicted below. You can observe that some lines are lower than others, this is because the slower compartments tolerate a lower supersaturation pressure than the faster tissues, and therefore have lower m-values for each depth.
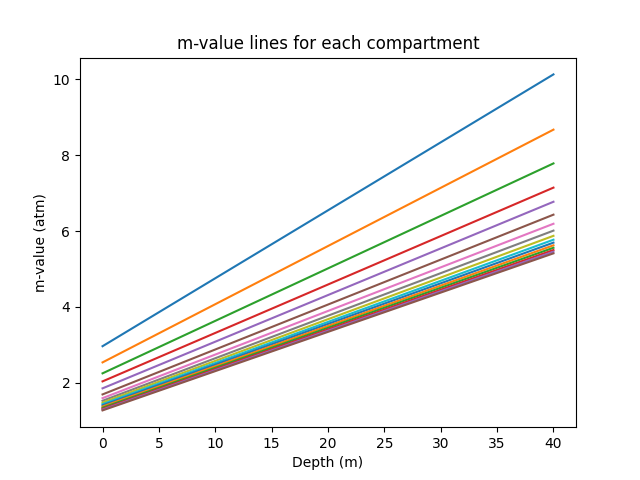
In a real decompression model, the computer would have to compare each compartment's nitrogen level with its respective m-value Line.
Introducing Gradient factors
As you can imagine, the m-value is close to the limit in terms of avoiding symptoms of DCS. Each diver has their own safety tolerance and what we can call conservatism (how close they are willing to get to the M-value). A more conservative setting on a computer will make the computer give a shorter no-decompression limit, and get the diver faster into decompression. A less conservative setting (also called aggressive) on a computer will allow the diver to stay at a certain depth for longer before entering into decompression.
We can control conservatism with m-values by using two values known as gradient factors. The two values are called GF low and GF high, and are usually represented as L/H (L being low, and H being high). They can be set at a value between 0 and 100, representing a percentage of the m-value, but they each control a different aspect of the decompression profile:
- GF low represents the percentage of the m-value in a compartment at which the first decompression stop will be generated. For a lower low gradient factor, the first stop will be deeper. Divers who prefer avoiding deep stops opt for a higher low gradient factor.
- GF high represents the percentage of the m-value that the compartments shouldn't exceed upon surfacing. At no point during the ascent will any of the compartments' gradients exceed the GF high.
For example, if a diver chooses gradient factors of 50/85 (which could be considered a normal conservatism), the diver wouldn't require any decompression if they do not exceed 85% of their surface m-value for any compartment. However, once that value is exceeded, the diver will be required to decompress; he will start with a depth where his leading compartment reaches 50% of its m-value saturation, and then slowly ramp up, until all the tissues are below 85% of the surface gradient factor, at which point, the diver will be allowed to surface.
Below is a graph showing how gradient factors are used to decompress/off-gas our tissues safely and staying away from the m-value line. In this example, we are using gradient factors of 50/80, the diver is breathing air, and we only look at a single compartment for the sake of demonstration.
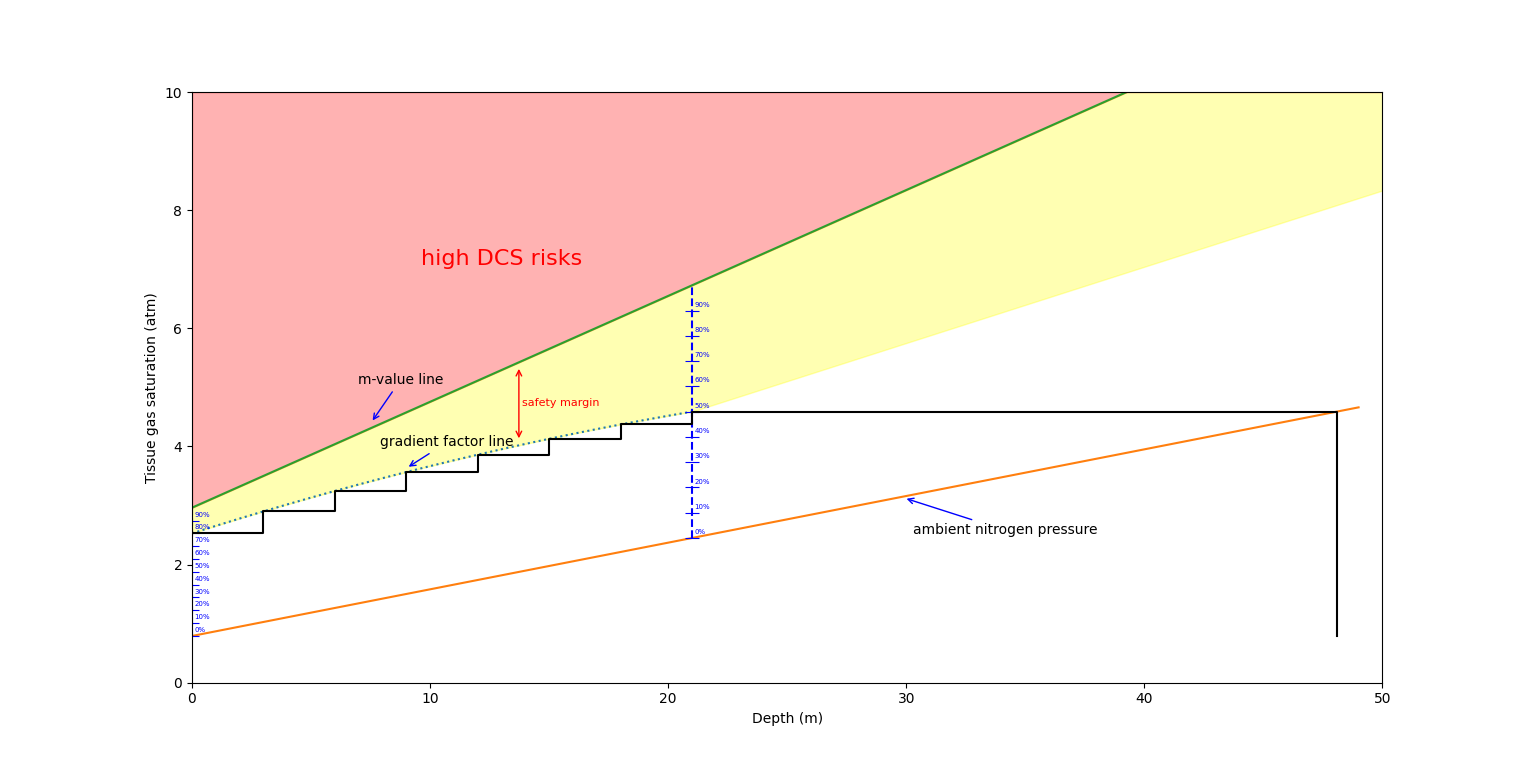
We can follow the black line to observe the evolution of the nitrogen tension in the compartment. When the diver starts, he is at a depth of about 48 meters, but the compartment is still completely unsaturated (the nitrogen pressure of 0.79 matches the surface nitrogen partial pressure), which is where the line start (bottom right). After some time, the tissue saturates, reaching the ambient nitrogen pressure line. After this, once the diver starts ascending, he reaches his first stop, at a depth of 21 meters, where his tissue saturation level matches 50% of the m-value. At this point, you can observe the diver alternating between various ascents and stops to off-gas the nitrogen in the compartment, while ensuring they stay below the gradient factor line. The ascent ramps up from an initial value of 50% of the m-value (at the first decompression stop) to 80% of the m-value (at the surface).
Note: notice how the graph here is a simplification of real models, in a real model, the tissue nitrogen saturation would also vary on ascents, which is neglected in this graph.
To read in more extensive detail about gradient factors, you can read this article.